Case · Go backend
Pulse: uptime monitor
An uptime monitor: scheduled HTTP and TCP checks, uptime, p50/p95, an incident detector, a live SSE dashboard and a public status page. Go + SQLite without CGO.
- Go
- SQLite
- SSE
- REST API
- Docker
01 · How it looks
Screenshots
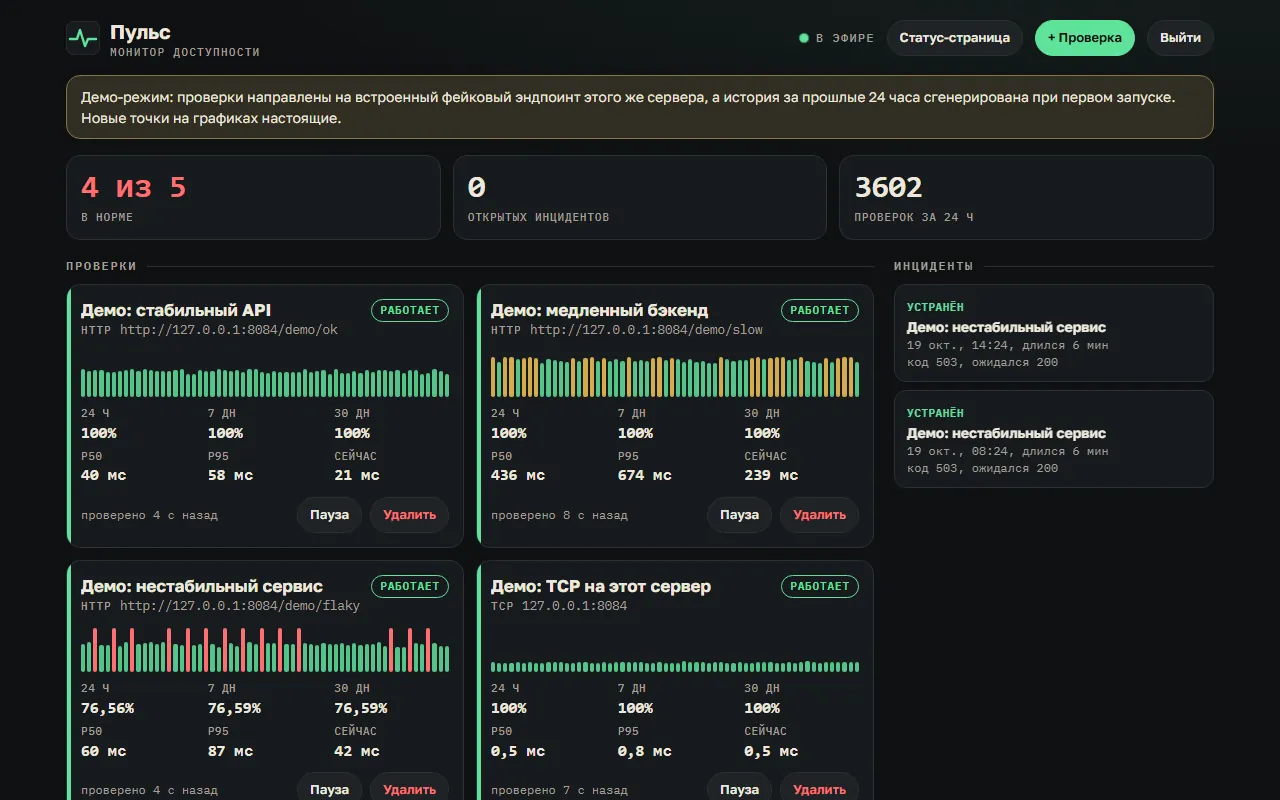
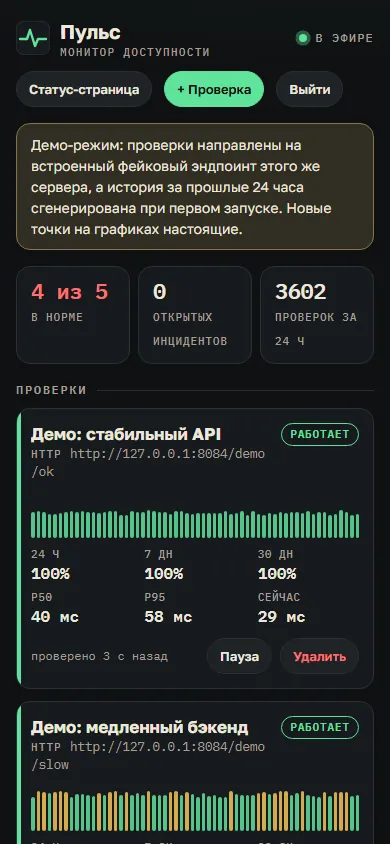
02 · About
What it is and why
Pulse is an uptime monitor: it checks HTTP addresses and TCP ports on a schedule, keeps the history in SQLite, calculates uptime and p50/p95 latency, and opens an incident after a series of consecutive failures.
Results appear on a live dashboard (updates over SSE) and on a public status page that does not reveal addresses or error texts. Go with no external dependencies except SQLite without CGO; the vanilla JS front end is embedded in the binary.
Limitations
In demo mode the history is generated to make the charts readable; everything that appears after startup is measured for real.
One node and one token, no notifications, and checks run only from the service's own machine. Uptime is calculated from the number of checks, and the HTTP response body is not analysed.
What is inside
- One worker goroutine per check with its own interval and timeout; runs for the same address never overlap
- HTTP GET (expected status, up to 5 redirects) and TCP connect
- Uptime over 24 h, 7 and 30 days, and p50/p95 latency over 24 h
- Incident detector: opens after N failures in a row, closes on the first success, survives a restart
- REST API behind a Bearer token, an SSE event stream, graceful shutdown, slog logging
- Tests (scheduler, detector, statistics, API, SSE) and Docker
03 · How to run
Run it locally
git clone <repository on request> uptime-monitor
cd uptime-monitor
SEED_DEMO=1 go run ./cmd/server # http://localhost:8084, token demo04 · Code
The repository is private
The source lives in a private repository. I will grant access on request: write to me and I will send an invitation.
Request the code